Plastic Zone Area View
In this view, you visualize the plastic zone area created with the Sanding Volume OH form (solids production > Sanding Analysis > Sanding Volume OH). The view shows the borehole in top view with the plastic area shown in the color of the corresponding production scenario. In case you have multiple production scenarios, upon opening of the view for the first time, all scenarios are shown. You can control the view via the Display tab, see below.
View the slice at the depth of interest by using the MD depth slider at the base (min and max are corresponding to the MD range as specified on the Sanding Evaluation Log form).
Plastic Zone Area View toolbar

|
Take screenshot Copy the current view to the clipboard for use in other applications. |

|
Save screenshot to file Save the current view to a file with a name and location you specify. |
|
|
Options Opens the Input and Display tabs at the right side of the screen. |
Input tab and Display tab
You can modify the data shown in the view via the options of the Input tab and Display tab. To open the Input tab and Display tab, click the Options icon (![]() ) located in the toolbar at the top of the view.
) located in the toolbar at the top of the view.
The Input tab shows the input parameters as specified on the Sanding Volume OH form. You can modify these parameters to see how results are sensitive to one or another parameter.
With the controls on the Display tab you can select and deselect production scenarios. In case you created multiple production scenarios with the Production Scenarios form, the color of the plastic area is taken by default from the corresponding color on that form. You can manage the areas visibility as well as review output values, such as area size and area radiuses (A and B, widest and smallest radius respectively).
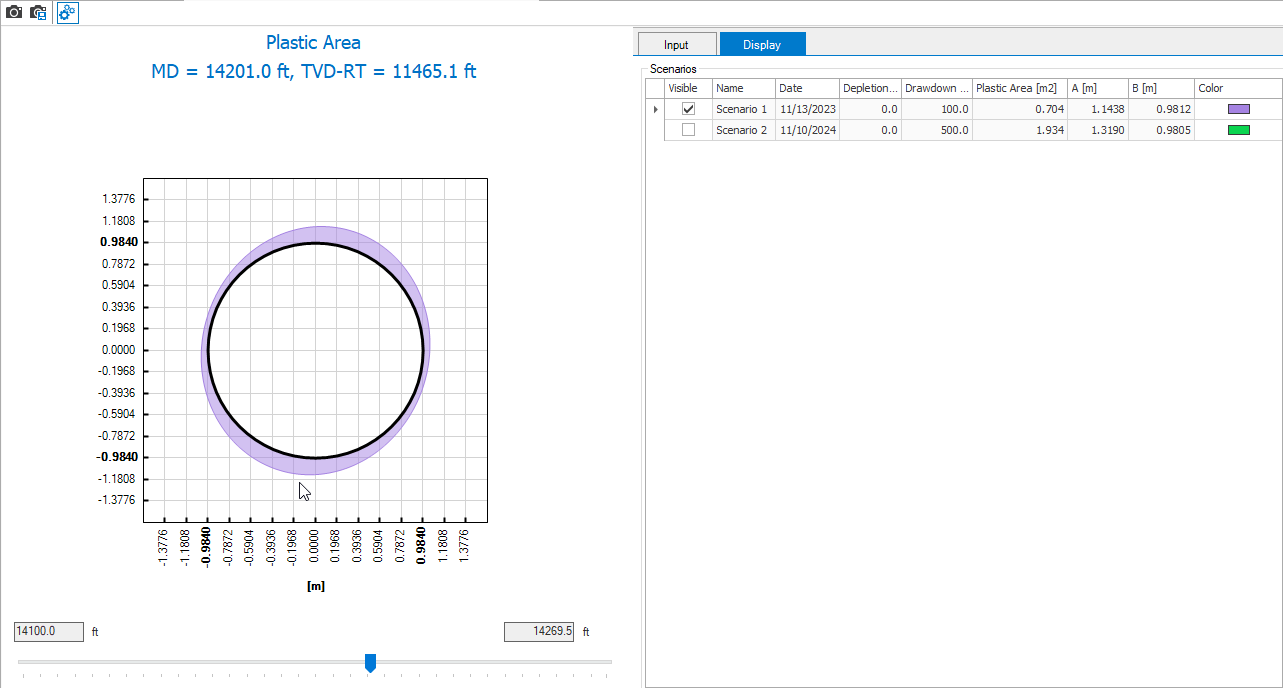
The dedicated Plastic Zone Area View with the plastic area of the wellbore displayed (in this example, production scenario 1 is displayed). You can open the Input tab or Display tab with the Options icon, located in the toolbar at the top of the view. click to enlarge